[Research] NHS spending on translation and interpreting services
Published on 17 May 2022
1. Executive summary
£65,962,418
Total NHS spending on translation and interpreting services for Trusts and Health Boards in the UK was £65,962,418 in 2019/2020 and £62,409,493 in 2018/2019. This included Welsh and services for the deaf and blind, i.e. British Sign Language (BSL) and braille.
Percentage of a Trust’s total expenses
Spending on translation and interpreting represented on average 0.057% of a Trust’s total expenses.
Spending on braille

Braille spending was generally either nil or negligible.
Yearly variation

There was an average increase of 6.2% every year between 2015/2016 and 2019/2020 in the total spending on translation and interpreting services (including BSL and Welsh).
Main drivers
In 2019/2020, spending on translation increased by 0.47%, interpreting by 0.4%, while BSL saw an increase of 21.81% compared to the previous year.
Spending per type of service

Translation represented 2.2%, interpreting 84.8%, and BSL 13% of the total spend on translation and interpreting services.
Employment of translators and interpreters

Except in Wales, the Trusts and Health Boards do not routinely employ translators and interpreters; they outsource these services.
Languages

Translations and interpreting were provided in approximately 120 languages (over the five-year period we looked at and across all of the UK).
Drop in 2020/2021

In 2020/2021 we estimate there was a 21% drop in spending on such services (based on a small sample data set provided by ten Trusts and Health Boards out of all 244 across the UK).
2. Background
2.1. Aims and objectives
We had set out to determine the amounts spent by the NHS Trusts and Health Boards on translation and interpreting services for foreign languages only (excluding any spending on Welsh, BSL and braille) in the UK for the last five financial years at that time, namely 2015/2016 to 2019/2020.
The second aim was to see what languages translation services and interpreting services were covered for each of the five financial years we analysed, and to look at how or if these languages differed from year to year.
2.2. Why this research
The main reason for this research is the lack of reliable and up-to-date data on the topic. The most recent previous study that we were able to locate was a report by 20/20health published a decade ago in 2012. Moreover, as set out in our Review of previous research section below, we believe the 2012 report has several weaknesses, which we aimed to address in the current study. This was also a fact-checking exercise.
The second reason is our own interest in this topic, as Inbox Translation is a medical translation services provider. However, it is important to point out that all the work we have undertaken in this area has been for private clients and not directly for the NHS. We have no public service contract and do not participate in such tenders, nor do we intend to do so in the future. This has enabled us to be completely objective in our data collection and reporting.
There is also a third reason for the study: when data about the costs of translation to the NHS are reported in the media, they are often presented using terms such as ‘astonishing’, ‘shocking’, ‘staggering’, or ‘ridiculous’. We believe that the figures should be presented in a more objective way and our report is intended to achieve that.
2.3. Terminology
Definitions of terms used:
Translation services – refers to written work (examples: forms, websites, leaflets, reports)
Interpreting services – refers to oral work (for example, during a patient-doctor appointment or live events such as conferences); it can be in person or via video/phone call
BSL – stands for British Sign Language (service for the people with a hearing impairment), type of interpreting
Braille – service for people with a sight impairment (written)
Briefly, translation involves working with the written text and is carried out by translators, interpreting with the spoken language and it is performed by interpreters. For more details, you can check our resource explaining the differences between what translators and interpreters do.
It is important to clarify the above terms that are used throughout the report, as one significant finding of our research is related to the widespread confusion about terminology relating to translation and interpreting. For example, one Trust provided a spending figure for face-to-face and telephone interpreting, then added that “No written (documents) interpretation required.”
3. Review of previous research
The only available data on the topic of NHS spending on translation and interpreting services that we could find is a 20/20health report published 10 years ago. While it makes an interesting contribution to information in this area, particularly given the lack of anything more recent or more comprehensive, we believe that it has several shortcomings:
It lacks accuracy
First of all, data collection for the study made no clear distinction between translation and interpreting. This led to confusion on the part of many respondents, as well as to inconsistencies in reporting of data. In turn, this may have introduced inaccuracies into the analysis and presentation of findings.
For example, the report claimed that in 2010/2011, “[…] some of the Trusts translated no material into other languages, some translated as many as 120.” However, since data collection did not distinguish between translation (written) and interpreting (oral), it is not clear whether this figure covers interpreting as well as translation services. Even the report states that “[…] a large number of Trusts either misinterpreting the questions or disputing the phrasing and definitions of the words used in the questions.”
Secondly, no information was provided on whether the figures presented in the report included or excluded Welsh, BSL, and braille spending.
It contains biased, erroneous, and incomplete interpretation of the data
The report includes the author’s personal opinions on the figures, describing these in terms that do not constitute factual, objective reporting. A few examples: the report mentions “a staggering £59k per day”, “[t]he news was perplexing”, “[…] spent an inordinate amount on translation”.
The report also makes far-fetched correlations “In three years (2008-2010), the police spent £82 million on translators whilst taking 16,000 police officers off the front line to ‘save costs’. It was this reduction in police capacity that directly resulted in a failure to cope with the riots that rocked London last summer.”
The study achieved a Trust response rate of 83%, but the reported findings could easily be interpreted as relating to all Trusts. Since they are based on an incomplete sample, the figures under-represent actual spending by Trusts on translation and interpreting services.
It makes some unsuitable recommendations
One of the top recommendations of the 20/20health report is the use of Google Translate as a means of cutting translation costs. However, there are two main issues with this:
- As revealed by our research, written translation represents a very small percentage of relevant spending (approximately 2.2%), with the majority being accounted for by interpreting. See section 5.3. Spending per type of service (translation, interpreting, BSL) in England, Scotland, and Northern Ireland.
- Google Translate is known to have high levels of unreliability and inaccuracy (especially for certain languages), which can have dangerous consequences in medical settings.
This recommendation is against the guidelines from Public Health England regarding translation and interpreting in primary care, which stipulate that, in order to ensure impartiality and reduce the risk of misinterpretation vital clinical information, a professional interpreter should be used, rather than using family or friends to interpret. They also specifically say: “Automated on-line translating systems or services such as “Google-translate” should be avoided as there is no assurance of the quality of the translations.”
Moreover, a 2021 study by researchers from UCLA Medical Center, Sylmar, CA, USA and Memorial Sloan Kettering Cancer Center, New York, NY, USA assessed the use of Google Translate in medical settings and found that it “[…] is not ready for prime time use in the emergency department.”
While the previous 20/20health report was the only one that focused on NHS spending on translation and interpreting services, the information presented is now outdated and the report had some limitations. Our study aims to reveal new and recent information, while also ensuring completeness and consistency in the data obtained.
4. Methodology
4.1. Overview
Data collection for the study consisted of sending Freedom of Information (FOI) requests to all NHS Trusts and Health Boards across the UK (full list in Appendix A). The FOI consisted of the following questions:
1. How much did your organisation spend on translation services (written) in the financial years 2015/2016, 2016/2017, 2017/2018, 2018/2019 and 2019/2020?
2. How much did your organisation spend on interpreting services (oral) in the financial years 2015/2016, 2016/2017, 2017/2018, 2018/2019 and 2019/2020?
3. What languages were covered by the above spending? Just to clarify, I do not need a breakdown of costs per language, just a yearly list of languages that were required (and paid for) for over those five years split (if possible) by translation (written) and interpreting (oral) services.
Additional instructions were provided to respondents and a data table included for the purpose of compiling the response. A copy of the FOI request and Excel table is shown in Appendix B.
4.2. FOI request – pilot
In December 2020 we started piloting the FOI request (see Appendix B) on seven NHS Trusts and Health Boards (from all four UK nations), and this demonstrated the need to expand on and clarify the types of information we were seeking. Some organisations that responded to the initial FOI failed to provide any data, saying they did not hold this information (though they sent the data later when we re-submitted the request), while others provided it as requested.
4.3. Timeline and scope of study
Having revised our questions (see Appendix B), the main study was conducted between February 2021 and March 2022 using Freedom of Information requests sent to all NHS Trusts and Health Boards across the UK (England, Wales, Scotland, and Northern Ireland).
FOI requests were sent to NHS organisations across the UK, but the figures presented are based on the data obtained from a total of 244 NHS Trusts and Health Boards (as of December 2020): 214 in England, 9 in Wales, 15 in Scotland, and 6 in Northern Ireland (full list in Appendix A). We did not include Clinical Commissioning Groups, Public Health, or other types of healthcare organisations in our figures. In total, over 3,500 emails were exchanged, translating into – excuse the pun – a few hundred hours that we spent conducting this research. The list was compiled in December 2020 from official sources:
https://www.nhs.uk/ServiceDirectories/Pages/NHSTrustListing.aspx
https://www.scot.nhs.uk/organisations/
https://gov.wales/nhs-wales-health-boards-and-trusts
https://www.nidirect.gov.uk/contacts/health-and-social-care-trusts
4.4. Response rate
The response rate was 100%, all the Trusts provided an official response to our Freedom of Information request, with fewer than 10% not able to provide historical data (i.e. for at least one year between 2015/2016 and 2016/2017).
For 2018/2019 and 2019/2020, we have data from all the NHS Trusts and Health Boards.
4.5. Challenges
Unclear question
We sent the majority of the FOI requests regarding spending excluding BSL in February 2021. However, as we started getting responses, we realised some of the Trusts misinterpreted part of the request or provided the data in a different format. Therefore, we:
- rephrased the request (making it clear that, if the data cannot be split between translation and interpreting services or between interpreting and BSL, total figures are OK) – see Appendix B for details, and
- followed up the responses and asked for clarification whether the figures provided were exclusive of BSL as requested or inclusive (in which case we asked for separate data for BSL if available).
Terminology
We found that most organisations do not distinguish between translation and interpreting when recording expenses and could only provide a total figure for both. In some cases, the data provided under interpreting included in fact the spending on translation as well, but not all had specified this. For example, some had marked translation spending as N/A, so we had to ask whether it was nil, not recorded/not available, or included in the interpreting spending.
Data recording
84% of the NHS organisations contacted were not able to provide separate data for spending on translation, interpreting, and BSL for all five years.
As some organisations provided the data inclusive of BSL and some exclusive of BSL, we later made subsequent FOI requests for BSL spending separately from the organisations that had initially excluded it, so that we could calculate the total spending on translation and interpreting services, including BSL (see Appendix B).
A large number of Trusts had included BSL in the figures provided as they do not record it separately but failed to mention this despite the fact that we had specifically asked them to provide data without BSL.
In many cases, even where Trusts confirmed that the figures they had provided were exclusive of BSL, when we subsequently asked for the separate figures for BSL, it turned out that the initial ones had in fact included BSL, despite our double checking and their confirmation they were exclusive.
We also challenged the BSL data on some occasions. For example, Lancashire Teaching Hospitals NHS Foundation Trust’s initial answer was that BSL spending was £0, but we challenged this based on our experience with other Trusts, and they came back with a different answer.
In some cases, as discovered when asking for the BSL spending separately, the Trusts tried to provide this, but they were not accurate due to the fact they are recorded together with other types of interpreting and/or translation.
These checks and clarifications have greatly delayed the research but provide a higher level of confidence in the data accuracy.
A few Trusts were unable to provide older data to meet the requirements due to it not being available ‘in a readily accessible format,’ meaning they would have had to manually search for the data by looking at individual invoices. We did not pursue this by making subsequent requests covering shorter time periods, so as not to put unnecessary pressure on the Trusts.
Mergers and historical data
There had been a number of mergers during the five financial years we requested the data for. In these cases, we asked the newly formed organisations to also provide historical data from the legacy organisations. Unfortunately, some were unable to do so, which is one of the reasons why we do not have data for all the years covered by the study.
Incorrectly applied exemptions, non-responsiveness, or refusals
Some Trusts initially refused to release the data by incorrectly applying Freedom of Information Act (FOIA) exemptions. For example, two Trusts invoked section 43 (Commercial interests), which we challenged. In both cases, the data was subsequently released, and the Trusts admitted that the exemption did not apply.
When there were issues with getting the data, we asked for an internal review (40+ requests). In most cases, this led to the release of the data. Where this was not the case, we complained to the Chief Executive (13 complaints) and/or the Information Commissioner’s Office (16 complaints); therefore, the response rate was 100%.
Incomplete figures or discrepancies
Where the Trusts specified that their data was only partial, for example due to mergers, change of suppliers or change of financial system, we excluded their data from the reported figures to ensure that these were as complete and as accurate as possible.
We also queried any apparent discrepancies in the reported data to ensure the figures were accurate.
Languages
We asked the Trusts to provide information on languages used for each of the five financial years on translation and interpreting services separately. However, the vast majority were unable to provide the information in this format, and many reported that they do not routinely record specific languages covered (e.g. Norfolk Community Health and Care NHS Trust said, “The Trust also does not collate which languages translation and interpreting services were provided for.”). Those who provided language data sent this as a list of:
- languages used for both translation and interpreting together
- languages they can potentially offer, or
- languages most commonly covered in translation/interpreting services.
This meant that analysing the data in the way we had originally intended was impossible. Instead, we collated the data regarding the languages that had been translated and/or interpreted from all the Trusts that were able to provide this information. This process also involved eliminating duplicates (for example, where two or more names or spellings of the same language were used, like Mandingo/Mandinka or Kirundi/Rundi), and correcting incorrect names for some languages (e.g. Cambodian for Khmer, Moldovan for Romanian).
5. Findings
5.1. Total spending on translation and interpreting services, including BSL
In 2019/2020, the total NHS spend on translation and interpreting services (including BSL, Braille, and Welsh) was £65,962,418, an increase of £3,552,925 (5.7%) from the previous year (2018/2019). For the other years, the data is partial since not all Trusts were able to provide historical data (please see Appendix C). Section 5.3. Spending per type of service (translation, interpreting, BSL) in England, Scotland, and Northern Ireland presents details on separate figures regarding the spending on each service.
Table 1 presents the figures for 2018/2019 and 2019/2020, including the spending on translation, interpreting, BSL, braille, and Welsh. The data was obtained from all 244 NHS Trusts and Health Boards.
| 2018/2019 | 2019/2020 | |
|---|---|---|
| Scotland (15 Health Boards) | £7,744,814 | £7,416,538 |
| Wales (9 Trusts and Health Boards) | £2,119,280 | £2,421,845 |
| England (214 Trusts) | £47,602,752 | £51,097,091 |
| Northern Ireland (6 Trusts) | £4,942,647 | £5,026,944 |
| UK Total (all 244 NHS Trusts and Health Boards) | £62,409,493 | £65,962,418 |
For 2015/2016, 2016/2017 and 2017/2018, not all NHS Trusts and Health Boards in England and Wales were able to provide the data due to the limitations discussed in the Methodology section. Table 2 shows the spending from all the Health Boards in Scotland and Northern Ireland, and from those in England and Wales that provided the data. A list of the Trusts and Health Boards for which we do not have data for each of these years can be found in Appendix C.
| 2015/2016 | 2016/2017 | 2017/2018 | |
|---|---|---|---|
| Scotland |
£6,110,506 Reporting Health Boards: 15 out of 15 |
£6,687,659 Reporting Health Boards: 15 out of 15 |
£7,221,273 Reporting Health Boards: 15 out of 15 |
| Wales |
£1,369,798 Reporting Trusts and Health Boards: 7 out of 9 |
£1,696,977 Reporting Trusts and Health Boards: 7 out of 9 |
£2,138,301 Reporting Trusts and Health Boards: 9 out of 9 |
| England |
£34,468,033 Reporting Trusts: 193 out of 214 |
£38,885,197 Reporting Trusts: 200 out of 214 |
£41,649,271 Reporting Trusts: 209 out of 214 |
| Northern Ireland |
£4,256,549 Reporting Trusts: 6 out of 6 |
£4,329,254 Reporting Trusts: 6 out of 6 |
£4,519,169 Reporting Trusts: 6 out of 6 |
| UK Total | £46,204,886 | £51,599,087 | £55,528,014 |
The spending for England above includes the spending for the regions detailed below and for the ambulance services (also detailed separately).
Table 3 presents the spending on translation and interpreting (including BSL) for Trusts in England, per region (defined as per NHS split). The Trusts that could not provide the data are listed in Appendix C.
| 2015/2016 | 2016/2017 | 2017/2018 | 2018/2019 | 2019/2020 | |
| East of England |
£2,343,281 Reporting Trusts: 20 out of 21 |
£2,571,873 Reporting Trusts: 20 out of 21 |
£2,657,828 Reporting Trusts: 20 out of 21 |
£3,729,536 Reporting Trusts: 21 out of 21 |
£4,153,334 Reporting Trusts: 21 out of 21 |
| London |
£10,082,013 Reporting Trusts: 31 out of 35 Trusts |
£11,668,868 Reporting Trusts: 33 out of 35 Trusts |
£12,096,719 Reporting Trusts: 34 out of 35 Trusts |
£13,494,811 Reporting Trusts: 35 out of 35 Trusts |
£14,150,921 Reporting Trusts: 35 out of 35 Trusts |
| Midlands |
£7,913,013 Reporting Trusts: 36 out of 38 |
£8,077,198 Reporting Trusts: 37 out of 38 |
£8,324,220 Reporting Trusts: 37 out of 38 |
£8,910,678 Reporting Trusts: 38 out of 38 |
£9,617,038 Reporting Trusts: 38 out of 38 |
| North East and Yorkshire |
£4,342,281 Reporting Trusts: 27 out of 31 |
£4,897,176 Reporting Trusts: 27 out of 31 |
£5,551,470 Reporting Trusts: 29 out of 31 |
£7,189,189 Reporting Trusts: 31 out of 31 |
£7,145,038 Reporting Trusts: 31 out of 31 |
| North West |
£5,124,043 Reporting Trusts: 29 out of 31 |
£5,797,128 Reporting Trusts: 31 out of 31 |
£6,461,410 Reporting Trusts: 31 out of 31 |
£7,131,325 Reporting Trusts: 31 out of 31 |
£7,745,947 Reporting Trusts: 31 out of 31 |
| South East |
£2,684,616 Reporting Trusts: 25 out of 28 |
£3,585,590 Reporting Trusts: 27 out of 28 |
£3,653021 Reporting Trusts: 28 out of 28 |
£3,999,192 Reporting Trusts: 28 out of 28 |
£4,698,239 Reporting Trusts: 28 out of 28 |
| South West |
£1,516,517 Reporting Trusts: 15 out of 20 |
£1,789,576 Reporting Trusts: 20 out of 20 |
£2,429,707 Reporting Trusts: 20 out of 20 |
£2,618,427 Reporting Trusts: 20 out of 20 |
£2,880,594 Reporting Trusts: 20 out of 20 |
For the ambulance services, the BSL spending was zero or minimal. The total spending on translation and interpreting (including BSL) is detailed in Table 4 (full data for all five years).
| 2015/2016 | 2016/2017 | 2017/2018 | 2018/2019 | 2019/2020 | |
|---|---|---|---|---|---|
| England ambulances |
£462,268 Reporting Trusts: 10 out of 10 |
£497,789 Reporting Trusts: 10 out of 10 |
£474,896 Reporting Trusts: 10 out of 10 |
£529,594 Reporting Trusts: 10 out of 10 |
£705,980 Reporting Trusts: 10 out of 10 |
5.2. Trends over the five-year period between 2015/2016-2019/2020
United Kingdom
In order to discover trends over the five years included in the research, we looked at the figures from the NHS organisations that were able to provide this data for all five years (220 out of 244 NHS Trusts and Health Boards, representing just over 90%).
The data in Table 5 is based on figures obtained from 220 NHS Trusts and Health Boards across all four UK nations that were able to provide full data for all five years. The yearly increase in spending is around 6.2% on average, resulting in an increase of 27.22% over the five years.
| Year | Spending | Variation |
|---|---|---|
| 2015/2016 | £45,992,656.45 | |
| 2016/2017 | £49,251,588.91 | 7.09% |
| 2017/2018 | £51,856,923.90 | 5.29% |
| 2018/2019 | £55,820,227.03 | 7.64% |
| 2019/2020 | £58,512,326.74 | 4.82% |
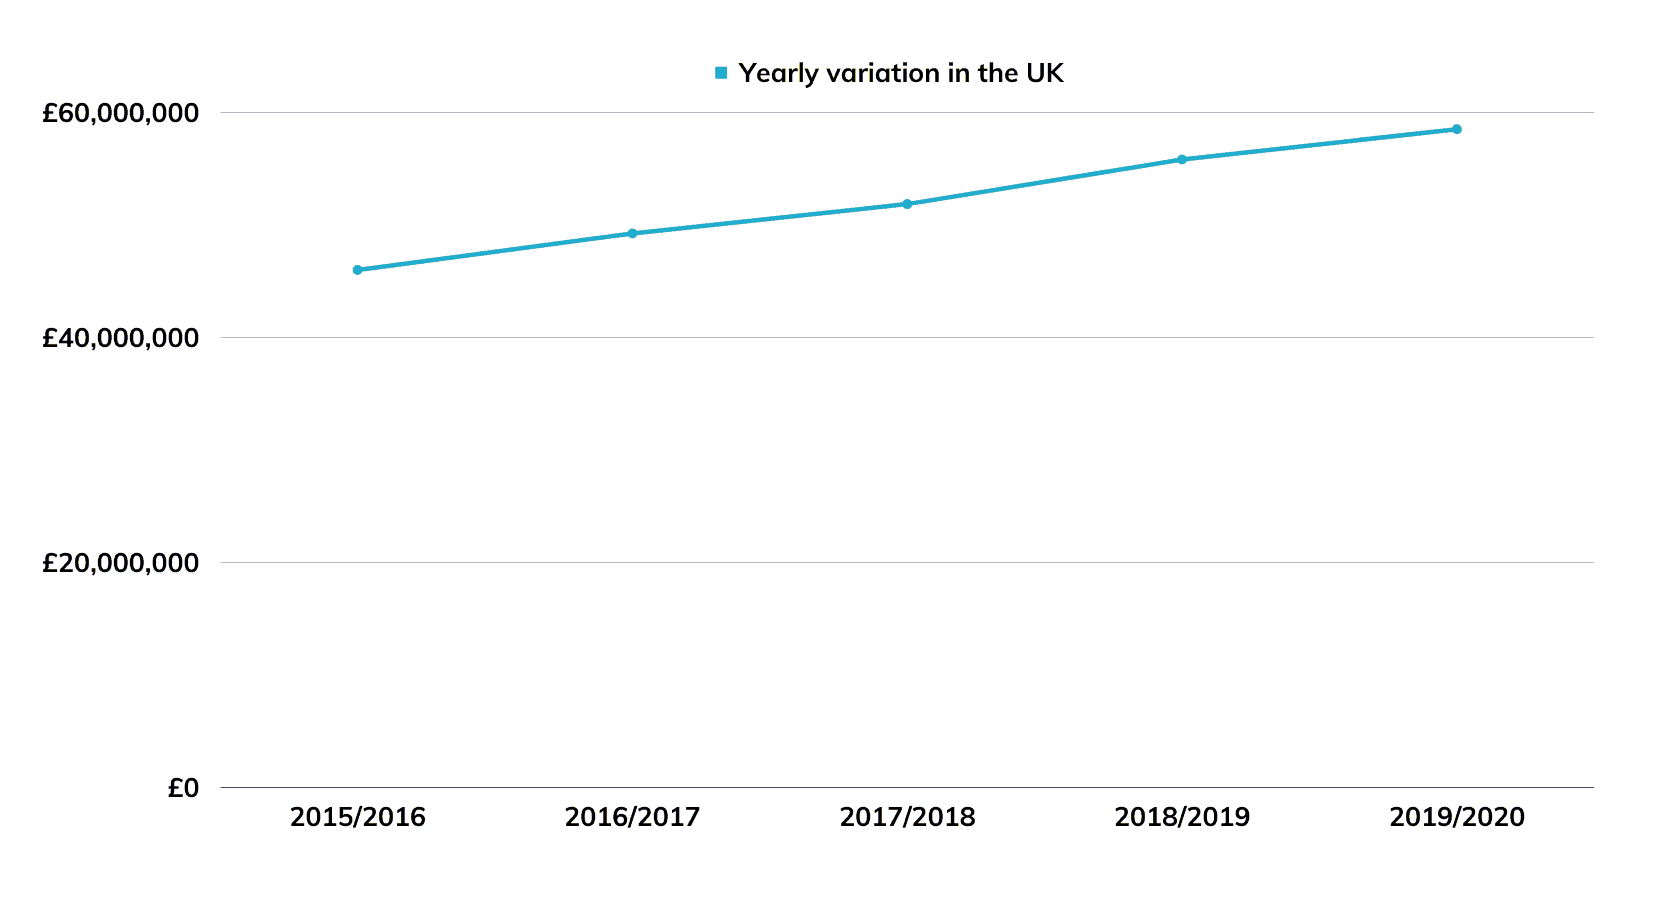
(based on figures obtained from 220 out of 244 NHS Trusts and Health Boards that provided full data for all five years)
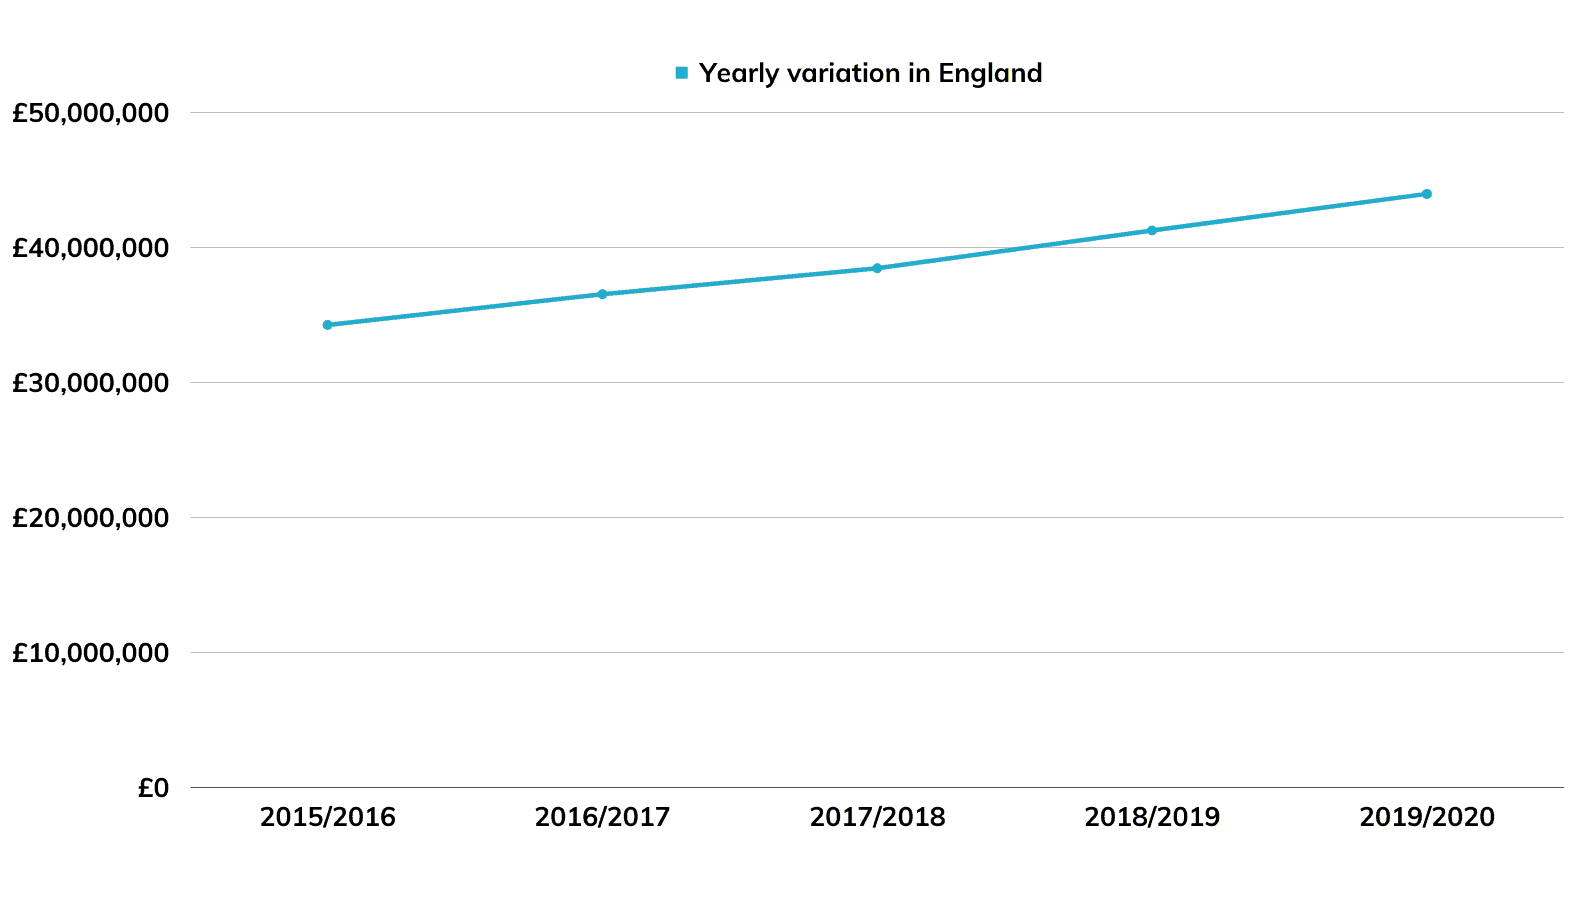
England
Figure 2 and Table 6 present the variations over the five years in England. The data was obtained from 193 out of 214 NHS Trusts in England (90%). The UK average of yearly increase is also reflected in England, which recorded an average increase of 6.4%, as illustrated in Table 6. The total increase in England over the five-year period analysed was 28.36% (slightly higher than the UK average).
| Year | Spending | Variation |
|---|---|---|
| 2015/2016 | £34,255,803.92 | |
| 2016/2017 | £36,537,698.51 | 6.66% |
| 2017/2018 | £38,465,916.33 | 5.28% |
| 2018/2019 | £41,261,973.87 | 7.27% |
| 2019/2020 | £43,971,837.60 | 6.57% |
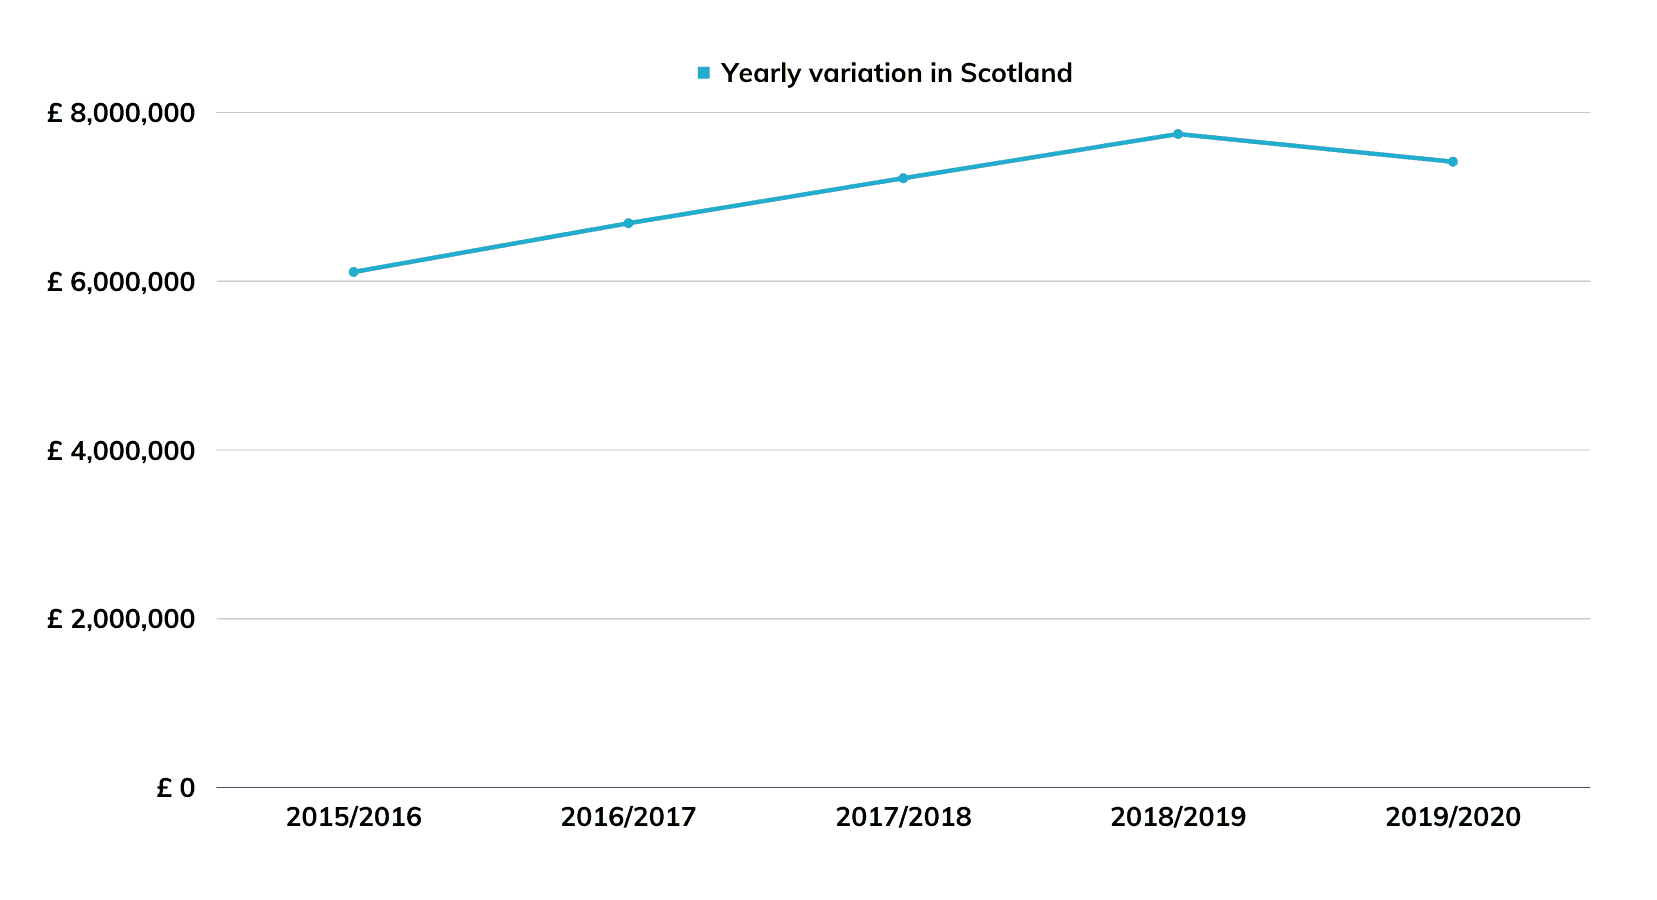
Scotland
Scotland saw a decrease in spending in 2019/2020. The average yearly variation was 5.1%, with a total increase of 21.37% over five years. All organisations in Scotland provided data for all five years.
| Year | Spending | Variation |
|---|---|---|
| 2015/2016 | £6,110,505.75 | |
| 2016/2017 | £6,687,659.31 | 9.45% |
| 2017/2018 | £7,221,273.04 | 7.98% |
| 2018/2019 | £7,744,814.21 | 7.25% |
| 2019/2020 | £7,416,538.03 | -4.24% |
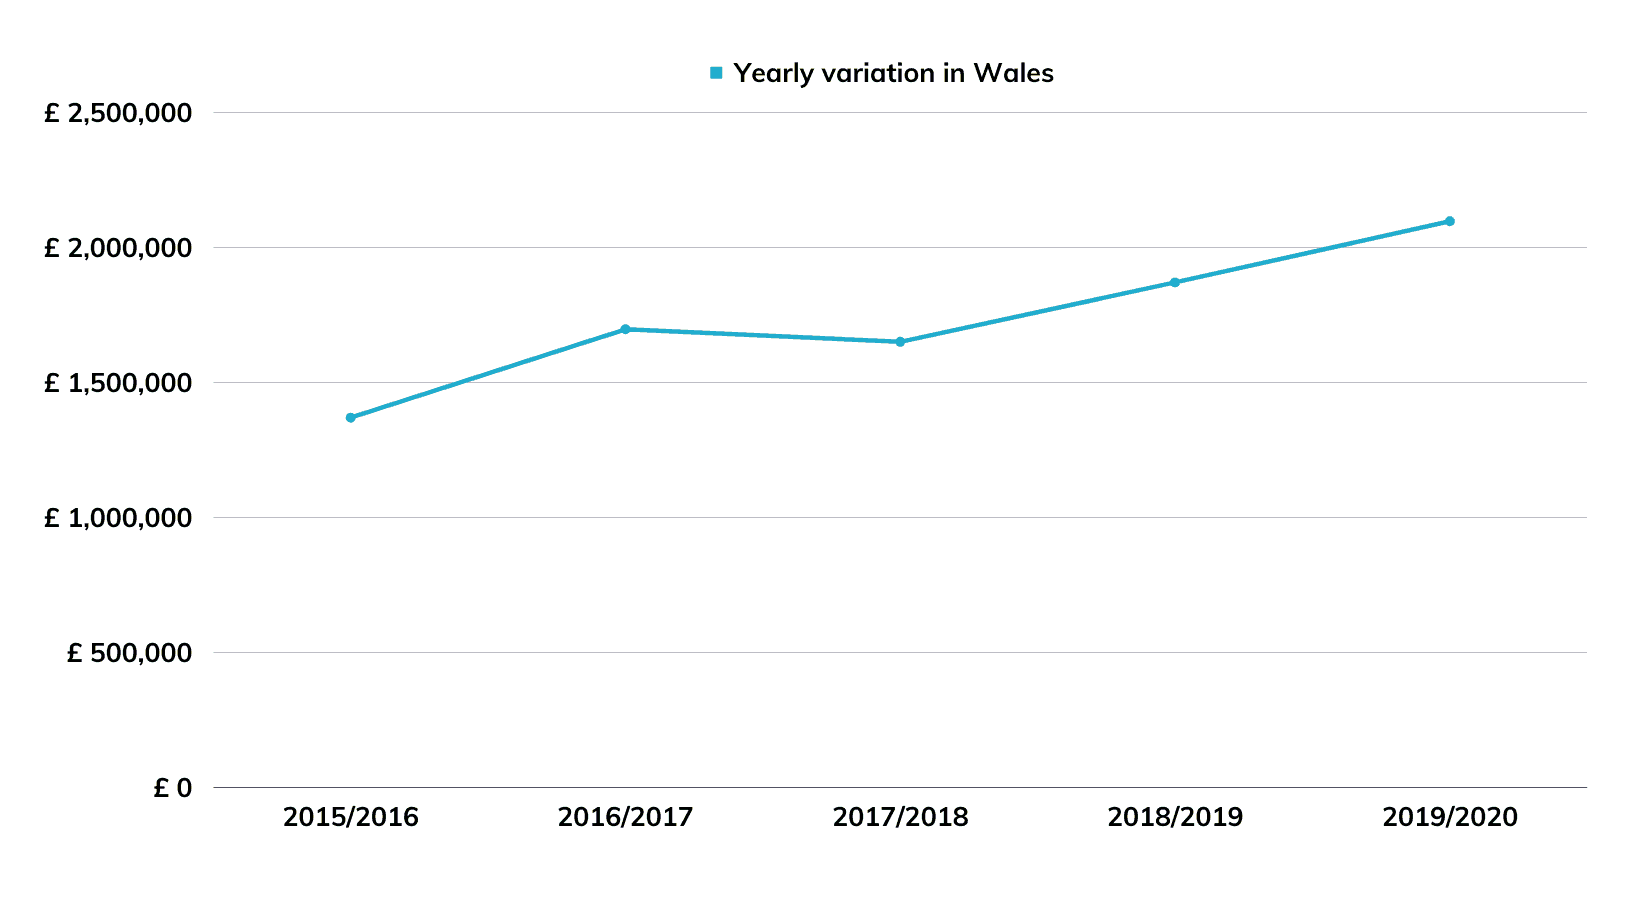
Wales
Wales recorded the highest yearly variations, with a 23.8% increase in 2016/2017 compared to the previous year, and an average variation of 11.6%, as shown in Table 8. Data was obtained for all five years from 7 out of 9 Welsh Trusts and Health Boards. Also, the total increase over the five years was 53.09%.
| Year | Spending | Variation |
|---|---|---|
| 2015/2016 | £1,369,797.83 | |
| 2016/2017 | £1,696,977.00 | 23.89% |
| 2017/2018 | £1,650,565.51 | -2.73% |
| 2018/2019 | £1,870,791.77 | 13.34% |
| 2019/2020 | £2,097,006.98 | 12.09% |
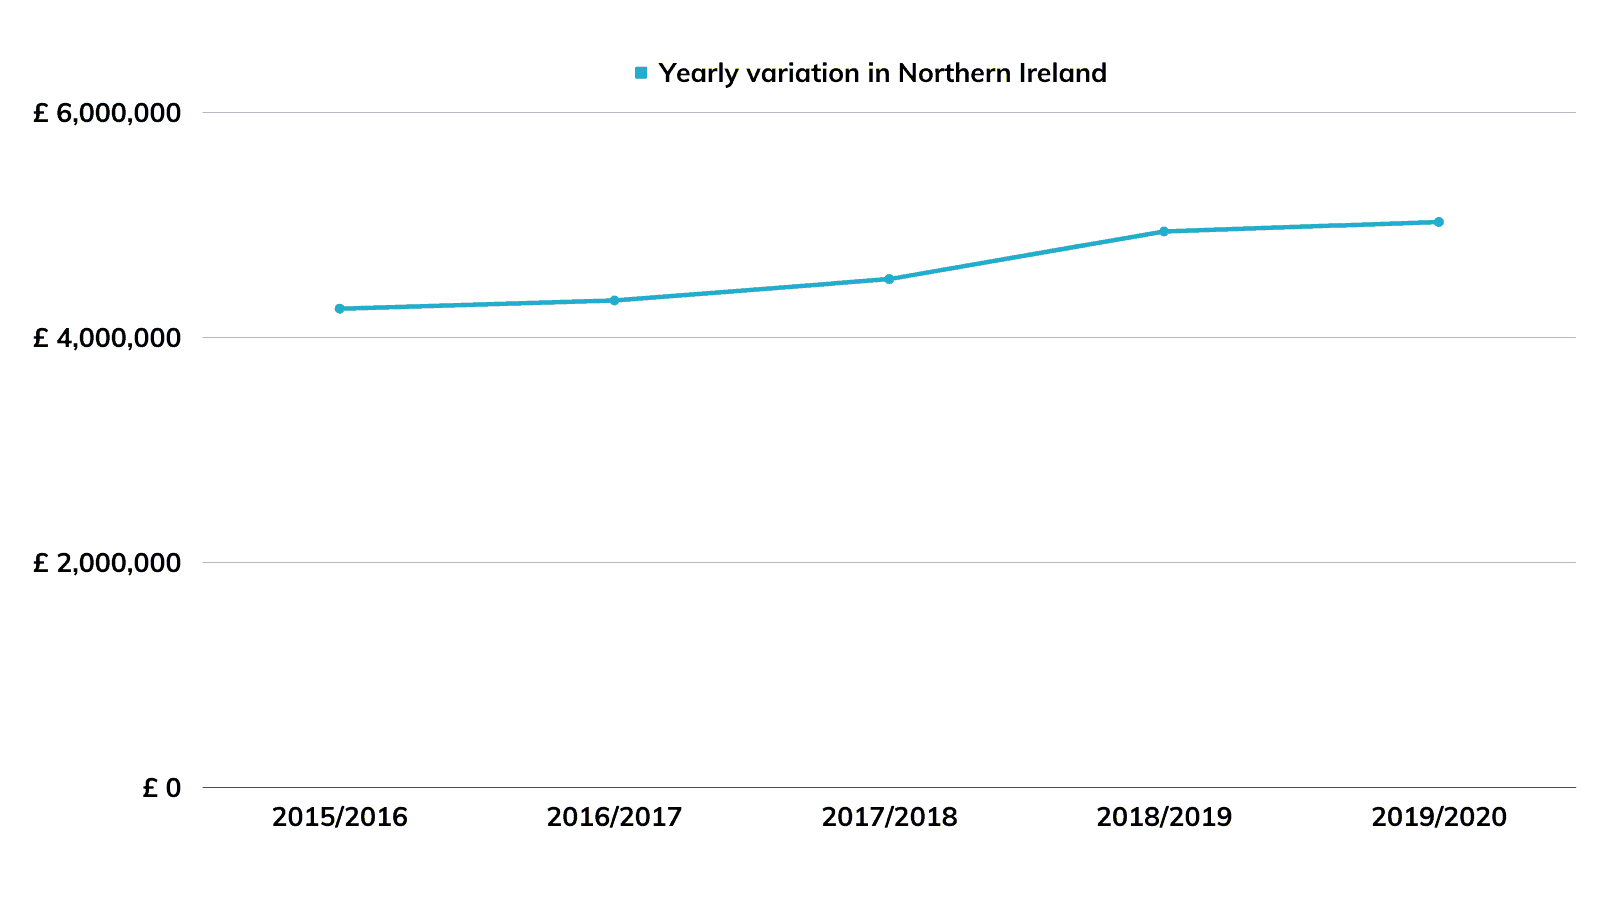
Northern Ireland
In Northern Ireland, the average variation was around 4.3%, with only 1.7% increase in 2016/2017 and 2019/2020 compared to the previous years (Table 9). Data for all Trusts for all five years. The total increase was lower than the UK average, with 18.10% recorded over the five years analysed.
| Year | Spending | Variation |
|---|---|---|
| 2015/2016 | £4,256,548.95 | |
| 2016/2017 | £4,329,254.09 | 1.71% |
| 2017/2018 | £4,519,169.02 | 4.39% |
| 2018/2019 | £4,942,647.18 | 9.37% |
| 2019/2020 | £5,026,944.13 | 1.71% |
5.3. Spending per type of service (translation, interpreting, BSL) in England, Scotland, and Northern Ireland
Of all the NHS Trusts and Health Boards in England, Scotland, and Northern Ireland, 39 were able to provide the spending separately per type of service for all of the five years we requested. We excluded Wales from this analysis, as the majority of the spending was for Welsh and could not be separated from the total expenses on translation and interpreting.
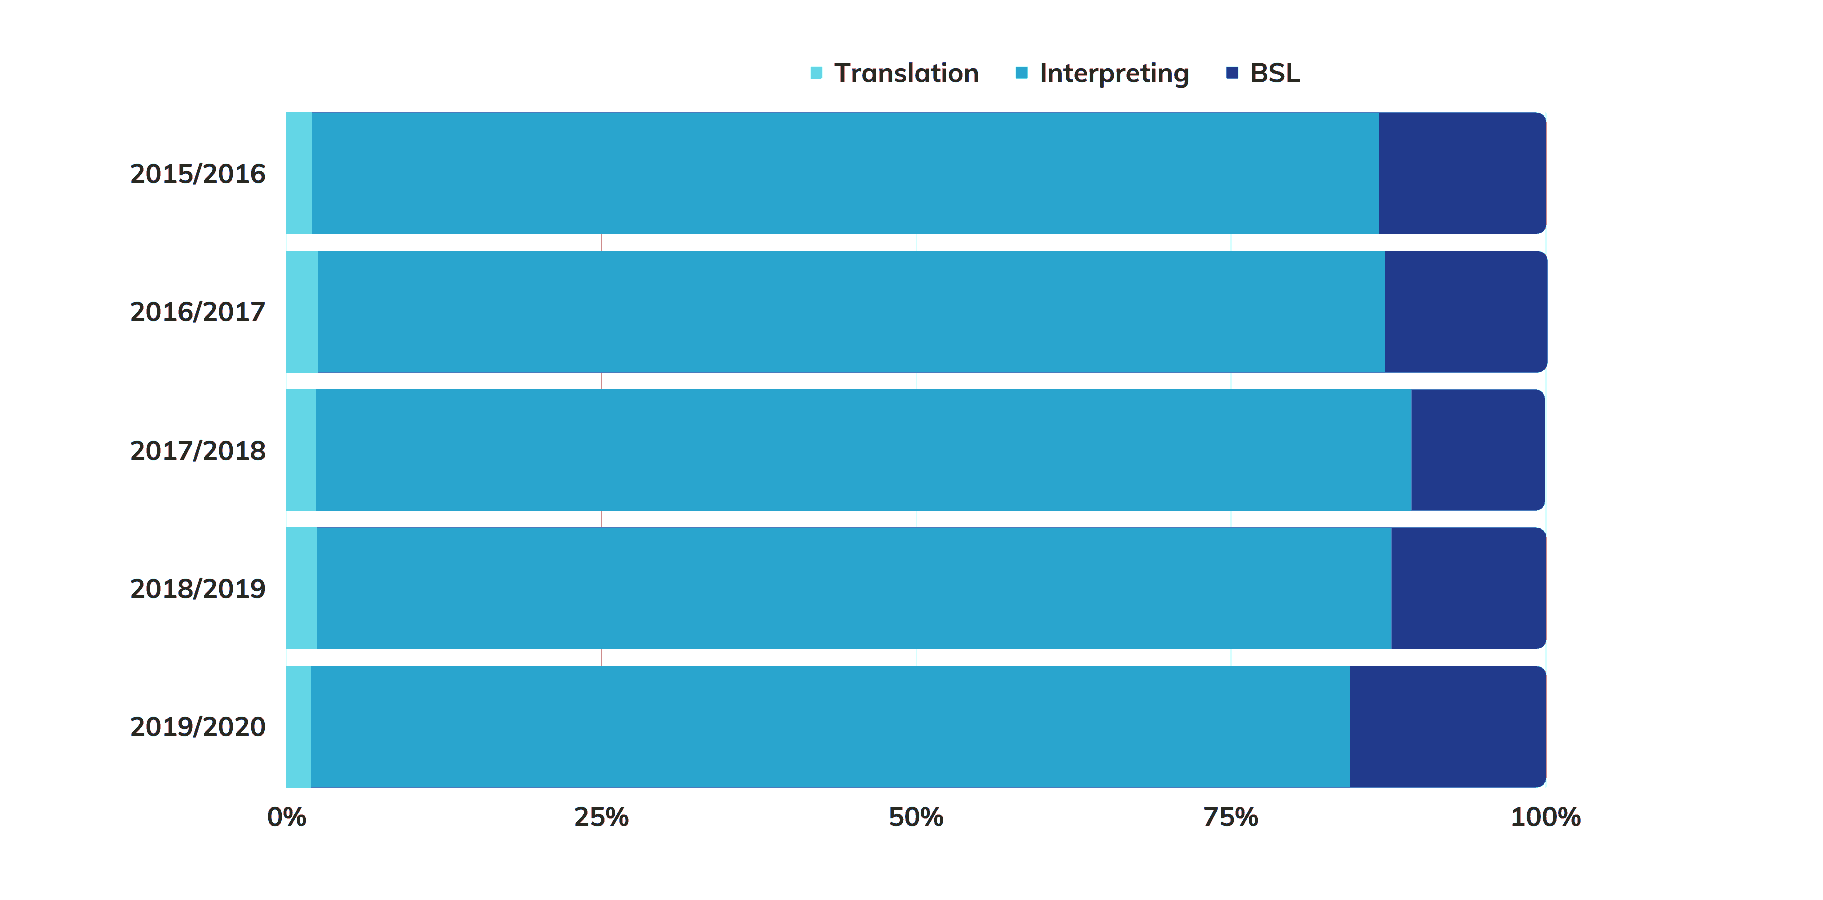
As shown in Fig. 6, across the five-year reporting period, interpreting accounted for an average of 84.8% of total annual spending (for the 39 organisations that could provide the data separately), BSL for 13%, and written translation for just 2.2%.
Looking at these figures, it becomes clear that recommendations about cutting down translation costs made in the 20/20health report would not lead to great savings as claimed.
For example, Wirral Community Health and Care NHS Foundation Trust does not record translation separately and described this spending as negligible.
In 2019/2020, Leeds Teaching Hospitals NHS Trust (a Trust seeing over “a million patients a year and with a budget of £789 million”) spent £784.96 on translation.
“Written translations are so few they are done at a local level and figures are not kept centrally.” (Coventry and Warwickshire Partnership NHS Trust)
“We are not able to identify annual spend in respect of translation services as this is not paid for centrally. Translation services are rarely used by HPFT as services are encouraged to use interpreters to translate and explain documentation to service users which is often the preferred option.” (Hertfordshire Partnership University NHS Foundation Trust)
“We have very few and far between requests for written translation, therefore either there was £0 spend during those years (N.B. between 2015/2016 and 2019/2020), or that spend would have been included in the face to face cost as no separate record is kept.” (Stockport NHS Foundation Trust)
The spending in 2019/2020 for England, Wales, Scotland, and Northern Ireland was £65,962,418. Based on the percentages above, we estimate* that the expenditure per type of service was as follows:
- translation: £1,450,000
- interpreting: £56,000,000
- BSL: £8,575,000
*The amounts per type of service are rounded and represent estimations based on percentage breakdowns from a sample of 39 NHS Trusts and Health Boards out of the 244 included in the research
5.3.1. Spending trends per type of service (translation, interpreting, BSL) in England, Scotland, and Northern Ireland in 2018/2019-2019/2020
As shown in section 5.2. Trends over the five-year period between 2015/2016-2019/2020, there was, on average, a 6% annual increase in the total spending on translation and interpreting services (including Welsh and BSL), with a total of approximately 27% over the five-year period. We decided to analyse this further and see whether the spending per type of service followed the same trend.
Given that the data in more recent years is better reported, the below figures are based on the data received from 61 Trusts and Health Boards in England, Scotland, and Northern Ireland (approximately 26% of NHS organisations in these three nations) that were able to provide the spending for each type of service (translation, interpreting, and BSL) separately. This analysis could not include any data from Wales, as the spending on Welsh translation and interpreting could not be separated from other spending on translation or interpreting services.
Trends over two years (2018/2019-2019/2020)
In the last two financial years included in our research (2018/2019-2019/2020), the trends in spending for each type of service (analysing data obtained from 61 Trusts and Health Boards in England, Scotland, and Northern Ireland) showed that in 2019/2020, the spending increased (compared to the previous year) by:
- 0.47% for translation services (foreign languages)
- 0.40% for interpreting services (foreign languages)
- 21.81% for British Sign Language.
These figures reveal that BSL spending is increasing and is probably the main driver of yearly increase in spending on all translation and interpreting services as a whole. We expect this trend to continue, especially in view of the recent BSL Bill, which recognises BSL as a language in England, Scotland and Wales.
5.3.2. Limitations/Concerns
It seems that when Trusts merge, the data cannot be retrieved in some cases. For example, North West Anglia NHS Foundation Trust was not able to provide any historical data from before the merger.
Another case was that of Frimley Health NHS Trust, who could not provide the data for 2015/2016, saying “[…] the Trust had 2 different finance systems for a period of time including 2015-16. The information requested was inputted onto 2 different systems and the translation service did not have a specific account code within the general finance ledger.”
In some cases, the real spending was higher because, for certain years, some of the services were carried out in-house, and no associated costs had been attributed or recorded. This was especially true in Wales for services involving the Welsh language.
Some Trusts (e.g. Barking, Havering and Redbridge University Hospitals NHS Trust) could not provide older data due to having records only in a paper format, meaning that the costs of complying with the request would have exceeded the appropriate limit as defined by the FOIA.
Not all Trusts were able to provide the data as requested (i.e. split by type: translation, interpreting, and BSL) for all the five years. Therefore, some of the analyses are based on figures only from those organisations that provided complete data.
5.3.3. Special cases
Wales
In Wales, translation and interpreting services are also provided in Welsh. Pay costs (i.e. employees/staff) were excluded from our analysis for all Welsh Trusts.
Aneurin Bevan Health Board’s spending on translation was exclusively for Welsh, no other languages. Some years have no recorded separate spending for Welsh, as it was done in-house but with no costs attributed. Later, they had Welsh translators appointed and costs attributed.
For the rest of the NHS Trusts and Health Boards in Wales, the majority of the total translation and interpreting spending is for Welsh.
Velindre University NHS Trust do not record any costs for Welsh interpreting: “We don’t require oral interpreting services for Welsh as we have a number of employees who are Welsh speakers.”
Northern Ireland
In Northern Ireland, some translation and interpreting services are managed by the Health and Social Care Board (HSCB) and by the Business Services Organisation (BSO) for and on behalf of Belfast Health and Social Care Trust, South Eastern Health and Social Care Trust, Northern Health and Social Care Trust, Southern Health and Social Care Trust, and Western Health and Social Care Trust.
Western Health and Social Care Trust advised that “The HSCB provides a regional remote sign language interpreting service. The BSO provides a regional foreign language face to face interpreting service. The Trust pays organisations to provide face to face sign language interpreting. The Trust also pays for foreign language telephone interpreting, written translations and some face to face foreign language interpreting when there is no availability by the BSO service.”
HSCB administers and pays for BSL, while BSO deals with foreign language translation and interpreting (costs attributed to each Trust).
Ambulance services (England, Wales, Scotland, and Northern Ireland)
The cost with written translation was usually nil or negligible (less than £1,000 per year).
Most ambulance services did not have any spending with BSL and braille; where they did, this was only occasionally and a small amount. For example, East Midlands Ambulance Service reported a spending of £96 in 2019/2020 on BSL.
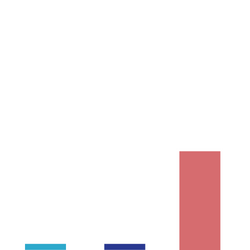
5.4. Top spenders
Table 10 shows the spending on translation and interpreting services (including BSL and braille) for 2018/2019 and 2019/2020 for the three organisations that recorded the highest figures.
NHS Greater Glasgow and Clyde spent £3,637,913 in 2019/2019 on translation and interpreting services (including BSL and braille). Probably not surprising, considering they are one of the UK’s largest providers of NHS health care services.
The second organisation is from Northern Ireland, where Southern Health and Social Care Trust spent £1,819,575 in 2019/2020.
In England, the top spender (and third in the UK) is Manchester University NHS Foundation Trust, with a spending of £1,736,364 in 2019/2020.
| Organisation | 2018/2019 | 2019/2020 |
|---|---|---|
| NHS Greater Glasgow and Clyde | £3,880,800 | £3,637,913 |
| Southern Health and Social Care Trust | £1,859,517 | £1,819,575 |
| Manchester University NHS Foundation Trust | £1,594,217 | £1,736,364 |
5.5. Data for 2020/2021
As ten NHS organisations (nine Trusts in England and one Health Board in Wales) also provided additional data for 2020/2021 along with full data for all previous five years, we looked at these in order to discover trends. For this small sample, we discovered a 21.2% drop in spending in 2020/2021 compared to the previous year. However, the sample may be too small to be an accurate representation for the whole of the UK.
5.6. BSL and braille
BSL
Only 16% of the NHS Trusts and Health Boards contacted were able to provide data for spending on translation, interpreting, and BSL separately for all five years. This is because the vast majority record these under one code in their financial system.
On average, based on the data obtained from those organisations that do record these figures separately for all five years, we found that spending on BSL interpreting represents 12.95% of the total spend on translation and interpreting (15.6% in 2019/2020).
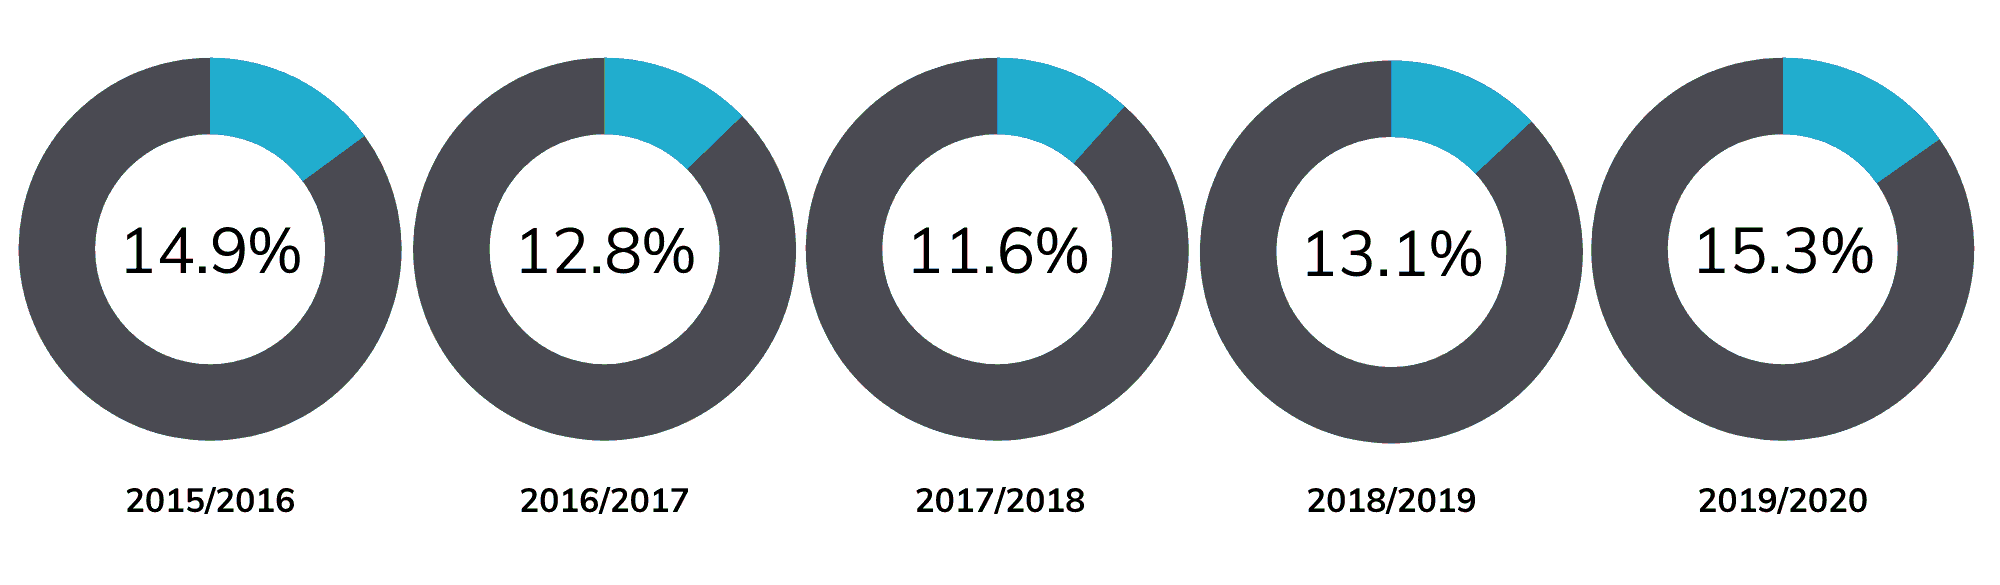
We then looked at the figures provided by the Trusts who could provide BSL data separately (even if they could not separate translation from interpreting). 29.5% of Trusts were able to send BSL data separately. The analysis shows similar findings in terms of the percentage that BSL spending represents of the total spending on all translation and interpreting services, with an average of 13.5% (15.3% in 2019/2020), as shown in Fig. 7.
BSL spending (%) out of the total expenditure on all translation and interpreting services
We noticed a great disparity between Trusts regarding spending on BSL. The Queen Elizabeth Hospital King’s Lynn NHS Foundation Trust says “[…] our total spend on BSL is less than 10% of our total spend, and in practice usually averages to no more than £1,000 per quarter”, while for other Trusts this was up to 30% of the total spending on translation and interpreting.
Some Trusts saw a sharp increase over the last three years. An example would be Cambridge University Hospitals NHS Foundation Trust that has seen an increase from a little over £10,000 in 2017/2018 (and even lower spending in 2015/2016 and 2016/2017) to almost £72,000 in 2019/2020.
The Trust advised that the reason for this spending increased was twofold:
“[…] We have also encouraged patients to use a trained professional interpreter rather than a family member/friend. Each year we see more patients and this will in turn increase the volume of patients we interpret and provide services for and the cost for these services.”
Braille
Some Trusts do not record braille separately, but it seems this spend is minimal or negligible.
“At Leeds Community Healthcare Trust, we have no records of anything specifically relating to braille translation.”
St Helens and Knowsley Teaching Hospitals NHS Trust spent £60 in five years on braille.
Despite our and the Trusts’ best efforts, some inaccuracies were inevitable. For example, some language service providers can also offer braille and BSL, and in some cases this spending was reported in the general language translation category.
5.7. Languages
After compiling the answers from all the Trusts that were able to provide some data for all the five years, and after eliminating duplicates or correcting misspelt language names, we discovered that translation and interpreting was offered in around 120 languages in total. (Please see Appendix D for the full list).
Disclaimer: Although we did our best to ensure the accuracy of data by diligently checking, confirming, and challenging it as applicable, we are aware that such an extensive research project is not immune to errors. Therefore, should you have any questions or comments that would help improve the data, please do not hesitate to get in touch with us, we would appreciate any feedback.
6. Discussion
6.1. Market share
According to the Language Services Industry Survey and report 2021 carried out by the Association of Translation Companies and Nimzi, the current size of the language services market in the UK is between GBP 1.5 and 1.7 billion. In 2018, this was around 1.35 billion, out of which just under half are UK clients. Therefore, the spending on translation and interpreting by the NHS Trusts and Health Boards represents around 9.6%.
6.2. Discrepancies
“Data is provided as correct at the time it was produced. It can and does sometimes happen that data can change over time if adjustments are made to payments or late invoicing or credit notes applied, so the later date should be taken as the final figure,” one Trust advised.
However, there were also a few Trusts that could not provide consistent figures when those were questioned. For example, the figures provided by one Trust as part of an internal review were different from the ones received a few weeks later as part of a response to our complaint.
There was also one organisation that we referred to the Parliamentary and Health Service Ombudsman for the way they handled the FOI requests. The Trust is adamant that in 2016/2017, their spending on BSL was £0. From our experience with all the other NHS organisations we contacted, this would mean it is unique in this respect. We questioned this but the Trust refused to look into it further.
The figures obtained from a third Trust were also different at various stages.
For all three organisations above, the figures used for the analyses in this report are the latest reported by each Trust. Despite all our best efforts to ensure all data is accurate, this may not have been achieved for all Trusts.
6.3. Reasons for increase in spending
We also wanted to understand the reasons behind the annual increase in spending, including for spending on BSL. Where there was a significant increase, we asked the Trusts and Health Boards to explain why.
Using professional interpreters instead of volunteers or family members
From our communication with the Trusts, we discovered that some Trusts had previously moved from using volunteers/staff/family members for interpreting to using accredited service providers only, which meant the spending in this area went up.
It was encouraging to see things moving in this direction, in line with the recommendations from Public Health England.
According to an article published in the British Medical Journal, using family members and interpreters comes with risks of misunderstandings and misdiagnosing:
“A family member may also give you their own version of events, and their emphasis may skew the whole consultation. It can also be difficult to check the veracity of the interpretation. This could lead to a misdiagnosis.”
“Similarly, a family member may find it hard to share difficult or bad news and they may have emotional or cultural reasons to distort your message. Or they may simply be bashful.”
National plans
Public Health Scotland* (or rather the organisations that were part of it at the time) recorded spending of less than £1,000 in 2015/2016 and 2016/2017, then up to £26,000 in 2019/2020.
The organisation explained: Scotland launched its national BSL Plan in October 2017 and there were some specific actions against NHS Health Scotland, which meant an increase in the NHS Health Scotland BSL outputs (https://www.gov.scot/publications/british-sign-language-bsl-national-plan-2017-2023)
*The data provided was not included in our analysis as we focused only on NHS Trusts and Health Boards
Increased number of patients
For example, Cambridge University Hospitals NHS Foundation Trust also mentioned that they have seen an increase in the number of patients each year, so this might be another reason explaining the increase of spending on such services.
6.4. Miscellaneous – dealing with FOI teams
There was a great variation in the level of service provided by the various FOI teams, from very poor practices to extremely helpful officers. Some examples of both the good and the bad are discussed below.
The majority of organisations that ask for feedback regarding FOI requests provided good service.
We noticed that when the FOI officers signed their emails, the experience of dealing with them was in general of a high standard. Conversely, some of the least successful communications were those where they only signed as ‘FOI team’ or similar. No signature meant, at times, no accountability.
There were some inconsistencies in the way FOI deadlines were calculated. For requests placed on the same day, different Trusts gave different deadlines.
Many Trusts responded on the last day. Maybe the ICO guidance should make it clearer that the deadline of 20 days does not mean one has to wait for 20 days before replying.
The majority of the Trusts indicated that if a requester is not satisfied with the answer, they could complain to ICO. However, if the response is not accurate (i.e. if the organisations do not send a true copy of the data requested as it happened in some cases), this is not in fact a matter for the ICO. The members of the public have no guidance on what to do next.
We also saw a few examples of good practices: University Hospital Southampton NHS Foundation Trust has a policy / guidelines in place for members of staff using interpreters (speak slowly, no jargon etc.) – example here: https://www.uhs.nhs.uk/Media/Controlleddocuments/General/interpretingservicespolicy.pdf
Some organisations, even if their own system did not record translation and interpreting separately, or they did not have a list of languages available, were extremely helpful and obtained this information from their language suppliers.
7. Conclusions
We believe that this study helps to fill a significant gap in available information about NHS spending on translation and interpreting services, as well as to address some of the weaknesses of earlier research in this area.
Using Freedom of Information (FOI) requests sent to all NHS Trusts and Health Boards across the UK, we managed to determine the total spending on all translation and interpreting services, including BSL, braille, and Welsh, for 2018/2019 and 2019/2020 (the most recent complete financial years at the time we started our research). Additionally, partial data was obtained for the previous three years, as not all Trusts were able to provide older data due to the limitations explained in the Methodology section.
Our research revealed that there is currently no reliable way to obtain accurate data from all organisations for each service type. For the period covered by our study, separate figures were not available for annual spending on translation or interpreting services on foreign languages or for these services combined but excluding BSL or Welsh (in the case of Wales), as many organisations do not record the data this way. We also found that it is exceedingly difficult to obtain historical data, especially when Trusts have merged. Despite these gaps, we were able to provide estimated figures for each service type based on the available data.
We had also set out to find which languages were translated and which languages interpreting services were provided in, for each of the five years from 2015/2016 to 2019/2020. We discovered that very few Trusts keep such a detailed record of languages. We did, however, manage to compile a list of all the languages in which either translation or interpreting was provided over this five-year period.
We also obtained data on the total annual expenses incurred by more than 100 Trusts and Health Boards. These were used to determine that spending on translation and interpreting represents on average around 0.057% of a Trust’s or Health Board’s total expenditure.
To put this into perspective, the total spending in 2018/2019 and 2019/2020 on translation and interpreting services (including services for the deaf and blind, as well as Welsh) relative to the UK population is the equivalent of just under £1 per person per year.
In conclusion, we believe that this study has generated valuable information on the overall NHS spending on translation and interpreting, while also highlighting weaknesses and limitations in data recording which make it impossible to provide a complete picture on spending on various types of services, and trends over time. The main recommendation arising from our research is for more comprehensive and consistent data recording on translation and interpreting services on the part of NHS organisations. If achieved, this could potentially be used by the NHS and service providers to improve service coverage and cost-effectiveness.
Finally, we are grateful to all the NHS organisations that took part in the study and hope that the research will be of interest and value to a wide audience.
8. Appendices
Appendix A – Full list of NHS organisations included in the report
England
Airedale NHS Foundation Trust
Alder Hey Children’s NHS Foundation Trust
Ashford and St Peter’s Hospitals NHS Foundation Trust
Avon and Wiltshire Mental Health Partnership NHS Trust
Barking, Havering and Redbridge University Hospitals NHS Trust
Barnet, Enfield and Haringey Mental Health NHS Trust
Barnsley Hospital NHS Foundation Trust
Barts Health NHS Trust
Bedfordshire Hospitals NHS Foundation Trust
Berkshire Healthcare NHS Foundation Trust
Birmingham and Solihull Mental Health NHS Foundation Trust
Birmingham Community Healthcare NHS Foundation Trust
Birmingham Women’s and Children’s NHS Foundation Trust
Black Country Healthcare NHS Foundation Trust
Blackpool Teaching Hospitals NHS Foundation Trust
Bolton NHS Foundation Trust
Bradford District Care NHS Foundation Trust
Bradford Teaching Hospitals NHS Foundation Trust
Bridgewater Community Healthcare NHS Foundation Trust
Brighton and Sussex University Hospitals NHS Trust
Buckinghamshire Healthcare NHS Trust
Calderdale and Huddersfield NHS Foundation Trust
Cambridge University Hospitals NHS Foundation Trust
Cambridgeshire and Peterborough NHS Foundation Trust
Cambridgeshire Community Services NHS Trust
Camden and Islington NHS Foundation Trust
Central and North West London NHS Foundation Trust
Central London Community Healthcare NHS Trust
Chelsea and Westminster Hospital NHS Foundation Trust
Cheshire and Wirral Partnership NHS Foundation Trust
Chesterfield Royal Hospital NHS Foundation Trust
Cornwall Partnership NHS Foundation Trust
Countess Of Chester Hospital NHS Foundation Trust
County Durham and Darlington NHS Foundation Trust
Coventry and Warwickshire Partnership NHS Trust
Croydon Health Services NHS Trust
Cumbria, Northumberland, Tyne and Wear NHS Foundation Trust
Dartford and Gravesham NHS Trust
Derbyshire Community Health Services NHS Foundation Trust
Derbyshire Healthcare NHS Foundation Trust
Devon Partnership NHS Trust
Doncaster and Bassetlaw Teaching Hospitals NHS Foundation Trust
Dorset County Hospital NHS Foundation Trust
Dorset Healthcare University NHS Foundation Trust
East and North Hertfordshire NHS Trust
East Cheshire NHS Trust
East Kent Hospitals University NHS Foundation Trust
East Lancashire Hospitals NHS Trust
East London NHS Foundation Trust
East Midlands Ambulance Service NHS Trust
East of England Ambulance Service NHS Trust
East Suffolk and North Essex NHS Foundation Trust
East Sussex Healthcare NHS Trust
Epsom and St Helier University Hospitals NHS Trust
Essex Partnership University NHS Foundation Trust
Frimley Health NHS Foundation Trust
Gateshead Health NHS Foundation Trust
George Eliot Hospital NHS Trust
Gloucestershire Health and Care NHS Foundation Trust
Gloucestershire Hospitals NHS Foundation Trust
Great Ormond Street Hospital for Children NHS Foundation Trust
Great Western Hospitals NHS Foundation Trust
Greater Manchester Mental Health NHS Foundation Trust
Guy’s and St Thomas’ NHS Foundation Trust
Hampshire Hospitals NHS Foundation Trust
Harrogate and District NHS Foundation Trust
Herefordshire and Worcestershire Health and Care NHS Trust
Hertfordshire Community NHS Trust
Hertfordshire Partnership University NHS Foundation Trust
Homerton University Hospital NHS Foundation Trust
Hounslow and Richmond Community Healthcare NHS Trust
Hull University Teaching Hospitals NHS Trust
Humber Teaching NHS Foundation Trust
Imperial College Healthcare NHS Trust
Isle Of Wight NHS Trust
James Paget University Hospitals NHS Foundation Trust
Kent and Medway NHS and Social Care Partnership Trust
Kent Community Health NHS Foundation Trust
Kettering General Hospital NHS Foundation Trust
King’s College Hospital NHS Foundation Trust
Kingston Hospital NHS Foundation Trust
Lancashire & South Cumbria NHS Trust
Lancashire Teaching Hospitals NHS Foundation Trust
Leeds and York Partnership NHS Foundation Trust
Leeds Community Healthcare NHS Trust
Leeds Teaching Hospitals NHS Trust
Leicestershire Partnership NHS Trust
Lewisham and Greenwich NHS Trust
Lincolnshire Community Health Services NHS Trust
Lincolnshire Partnership NHS Foundation Trust
Liverpool Heart and Chest Hospital NHS Foundation Trust
Liverpool University Hospitals NHS Foundation Trust
Liverpool Women’s NHS Foundation Trust
London Ambulance Service NHS Trust
London North West University Healthcare NHS Trust
Maidstone and Tunbridge Wells NHS Trust
Manchester University NHS Foundation Trust
Medway NHS Foundation Trust
Mersey Care NHS Foundation Trust
Mid and South Essex NHS Foundation Trust
Mid Cheshire Hospitals NHS Foundation Trust
Mid Yorkshire Hospitals NHS Trust
Midlands Partnership NHS Foundation Trust
Milton Keynes University Hospital NHS Foundation Trust
Moorfields Eye Hospital NHS Foundation Trust
Norfolk and Norwich University Hospitals NHS Foundation Trust
Norfolk and Suffolk NHS Foundation Trust
Norfolk Community Health and Care NHS Trust
North Bristol NHS Trust
North Cumbria Integrated Care NHS Foundation Trust
North East Ambulance Service NHS Foundation Trust
North East London NHS Foundation Trust
North Middlesex University Hospital NHS Trust
North Staffordshire Combined Healthcare NHS Trust
North Tees and Hartlepool NHS Foundation Trust
North West Ambulance Service NHS Trust
North West Anglia NHS Foundation Trust
North West Boroughs Healthcare NHS Foundation Trust
Northampton General Hospital NHS Trust
Northamptonshire Healthcare NHS Foundation Trust
Northern Devon Healthcare NHS Trust
Northern Lincolnshire and Goole NHS Foundation Trust
Northumbria Healthcare NHS Foundation Trust
Nottingham University Hospitals NHS Trust
Nottinghamshire Healthcare NHS Foundation Trust
Oxford Health NHS Foundation Trust
Oxford University Hospitals NHS Foundation Trust
Oxleas NHS Foundation Trust
Pennine Care NHS Foundation Trust
Portsmouth Hospitals NHS Trust
Queen Victoria Hospital NHS Foundation Trust
Rotherham Doncaster and South Humber NHS Foundation Trust
Royal Berkshire NHS Foundation Trust
Royal Brompton & Harefield NHS Foundation Trust
Royal Cornwall Hospitals NHS Trust
Royal Devon and Exeter NHS Foundation Trust
Royal Free London NHS Foundation Trust
Royal National Orthopaedic Hospital NHS Trust
Royal Papworth Hospital NHS Foundation Trust
Royal Surrey NHS Foundation Trust
Royal United Hospitals Bath NHS Foundation Trust
Salisbury NHS Foundation Trust
Sandwell and West Birmingham Hospitals NHS Trust
Sheffield Children’s NHS Foundation Trust
Sheffield Health & Social Care NHS Foundation Trust
Sheffield Teaching Hospitals NHS Foundation Trust
Sherwood Forest Hospitals NHS Foundation Trust
Shrewsbury and Telford Hospital NHS Trust
Shropshire Community Health NHS Trust
Solent NHS Trust
Somerset NHS Foundation Trust
South Central Ambulance Service NHS Foundation Trust
South East Coast Ambulance Service NHS Foundation Trust
South London and Maudsley NHS Foundation Trust
South Tees Hospitals NHS Foundation Trust
South Tyneside and Sunderland NHS Foundation Trust
South Warwickshire NHS Foundation Trust
South West London and St George’s Mental Health NHS Trust
South West Yorkshire Partnership NHS Foundation Trust
South Western Ambulance Service NHS Foundation Trust
Southern Health NHS Foundation Trust
Southport and Ormskirk Hospital NHS Trust
St George’s University Hospitals NHS Foundation Trust
St Helens and Knowsley Teaching Hospitals NHS Trust
Stockport NHS Foundation Trust
Surrey and Borders Partnership NHS Foundation Trust
Surrey and Sussex Healthcare NHS Trust
Sussex Community NHS Foundation Trust
Sussex Partnership NHS Foundation Trust
Tameside and Glossop Integrated Care NHS Foundation Trust
Tavistock and Portman NHS Foundation Trust
Tees, Esk and Wear Valleys NHS Foundation Trust
The Christie NHS Foundation Trust
The Clatterbridge Cancer Centre NHS Foundation Trust
The Dudley Group NHS Foundation Trust
The Hillingdon Hospitals NHS Foundation Trust
The Newcastle Upon Tyne Hospitals NHS Foundation Trust
The Princess Alexandra Hospital NHS Trust
The Queen Elizabeth Hospital, King’s Lynn NHS Foundation Trust
The Robert Jones and Agnes Hunt Orthopaedic Hospital NHS Foundation Trust
The Rotherham NHS Foundation Trust
The Royal Marsden NHS Foundation Trust
The Royal Orthopaedic Hospital NHS Foundation Trust
The Royal Wolverhampton NHS Trust
The Walton Centre NHS Foundation Trust
Torbay and South Devon NHS Foundation Trust
United Lincolnshire Hospitals NHS Trust
University College London Hospitals NHS Foundation Trust
University Hospital Southampton NHS Foundation Trust
University Hospitals Birmingham NHS Foundation Trust
University Hospitals Bristol and Weston NHS Foundation Trust
University Hospitals Coventry and Warwickshire NHS Trust
University Hospitals Dorset NHS Foundation Trust
University Hospitals of Derby and Burton NHS Foundation Trust
University Hospitals Of Leicester NHS Trust
University Hospitals Of Morecambe Bay NHS Foundation Trust
University Hospitals of North Midlands NHS Trust
University Hospitals Plymouth NHS Trust
Walsall Healthcare NHS Trust
Warrington and Halton Hospitals NHS Foundation Trust
West Hertfordshire Hospitals NHS Trust
West London NHS Trust
West Midlands Ambulance Service NHS Foundation Trust
West Suffolk NHS Foundation Trust
Western Sussex Hospitals NHS Foundation Trust
Whittington Health NHS Trust
Wirral Community Health & Care NHS Foundation Trust
Wirral University Teaching Hospital NHS Foundation Trust
Worcestershire Acute Hospitals NHS Trust
Wrightington, Wigan and Leigh NHS Foundation Trust
Wye Valley NHS Trust
Yeovil District Hospital NHS Foundation Trust
York Teaching Hospital NHS Foundation Trust
Yorkshire Ambulance Service NHS Trust
Wales
Aneurin Bevan Health Board
Betsi Cadwaladr University Health Board
Cardiff & Vale University Health Board
Cwm Taf Morgannwg Health Board
Hywel Dda Health Board
Powys Teaching Health Board
Swansea Bay University Health Board
Velindre University NHS Trust
Welsh Ambulance Services NHS Trust
Scotland
NHS Ayrshire & Arran
NHS Borders
NHS Dumfries and Galloway
NHS Fife
NHS Forth Valley
NHS Grampian
NHS Greater Glasgow and Clyde
NHS Highland
NHS Lanarkshire
NHS Lothian
NHS Orkney
NHS Shetland
NHS Tayside
NHS Western Isles
Scottish Ambulance Service
Northern Ireland
Belfast Health and Social Care Trust
Northern Health and Social Care Trust
South Eastern Health and Social Care Trust
Southern Health and Social Care Trust
Western Health and Social Care Trust
Northern Ireland Ambulance Service Trust
Appendix B – FOI requests
Pilot FOI request
I would like to make a request for information under the Freedom of Information Act regarding the spending per annum on translation services (written) and interpreting services (oral) for your organisation over each of the last 5 financial years, as well as the languages involved. Please do not include data regarding the spending on services for the deaf and blind (such as sign language interpreting or braille).
Initial FOI request
I would like to make a request for information under the Freedom of Information Act regarding the following:
The spending per financial year on translation services (written) and interpreting services (oral) for your organisation over each of the following 5 financial years: 2015/2016, 2016/2017, 2017/2018, 2018/2019, 2019/2020, as well as the languages involved. Please do not include data regarding the spending on services for the deaf and blind (such as sign language interpreting or braille).
The Trusts were also asked to supply the data in an Excel format, and the document we sent included two tabs – one for them to fill in with the data and one with an example of what was expected.
Rephrased FOI request
I would like to make a request for information under the Freedom of Information Act regarding the following:
1. How much did your organisation spend on translation services (written) in the financial years 2015/2016, 2016/2017, 2017/2018, 2018/2019 and 2019/2020?
2. How much did your organisation spend on interpreting services (oral) in the financial years 2015/2016, 2016/2017, 2017/2018, 2018/2019 and 2019/2020?
For the above questions (question 1 + question 2), if your records give a total figure for translation and interpreting and you cannot give separate figures, please mention this in your reply.
For the interpreting spending (question 2), please mention whether it includes or excludes British Sign Language (BSL). Ideally, I would prefer the spending without BSL, but do let me know what data you can provide.
| Financial year | £ spent on translation services (written) | £ spent on interpreting services (oral) | Comments/Mentions |
| 2015/2016 | |||
| 2016/2017 | |||
| 2017/2018 | |||
| 2018/2019 | |||
| 2019/2020 |
3. What languages were covered by the above spending? Just to clarify, I do not need a breakdown of costs per language, just a yearly list of languages that were required (and paid for) for over those five years split (if possible) by translation (written) and interpreting (oral) services.
Languages for which translation services (written) were contracted and paid for
| 2015/2016 | 2016/2017 | 2017/2018 | 2018/2019 | 2019/2020 |
|---|---|---|---|---|
Languages for which interpreting services (oral) were contracted and paid for
| 2015/2016 | 2016/2017 | 2017/2018 | 2018/2019 | 2019/2020 |
|---|---|---|---|---|
FOI regarding BSL spending
I would like to make a request under the Freedom of Information Act regarding the following:
What was the spending per financial year on services for the deaf and blind – such as British Sign Language (BSL) and braille – for your organisation in each of the following financial years:
2015/2016
2016/2017
2017/2018
2018/2019
2019/2020
Background: This data, combined with the data previously requested, will give a complete picture of the spending on translation and interpreting services on foreign languages and on services for the deaf and blind that facilitates the communication between patients and medical professionals. I am carrying out this research UK-wide and the data obtained from your organisation and from all the NHS Trusts and organisations will be compiled, analysed and published on https://inboxtranslation.com/, so it will be available to the general public on a non-commercial basis for anyone interested in this information.
If there is anything unclear in my request, you cannot send the data as requested or would like more information, please let me know.
Appendix C – Missing figures – Spending on translation and interpreting services, including BSL
2015/2016
Wales
No data from Velindre University NHS Trust and Swansea Bay University Health Board.
England
Data missing from University Hospitals Of Leicester NHS Trust, North West Anglia NHS Foundation Trust, Mid Yorkshire Hospitals NHS Trust, Leeds Teaching Hospitals NHS Trust, Barking, Havering and Redbridge University Hospitals NHS Trust, Doncaster and Bassetlaw Teaching Hospitals NHS Foundation Trust, Queen Victoria Hospital NHS Foundation Trust, Sheffield Health & Social Care NHS Foundation Trust, West London NHS Trust, Solent NHS Trust, North East London NHS Foundation Trust, Gloucestershire Health and Care NHS Foundation Trust, Cornwall Partnership NHS Foundation Trust, Yeovil District Hospital NHS Foundation Trust, Torbay and South Devon NHS Foundation Trust, The Rotherham NHS Foundation Trust, Tameside and Glossop Integrated Care NHS Foundation Trust, South Warwickshire NHS Foundation Trust, Northern Devon Healthcare NHS Trust, Guy’s and St Thomas’ NHS Foundation Trust, Frimley Health NHS Foundation Trust, Countess Of Chester Hospital NHS Foundation Trust
2016/2017
Wales
No data from Velindre University NHS Trust and Swansea Bay University Health Board.
England
Data missing from University Hospitals Of Leicester NHS Trust, North West Anglia NHS Foundation Trust, Mid Yorkshire Hospitals NHS Trust, Leeds Teaching Hospitals NHS Trust, Barking, Havering and Redbridge University Hospitals NHS Trust, Doncaster and Bassetlaw Teaching Hospitals NHS Foundation Trust, Queen Victoria Hospital NHS Foundation Trust, Sheffield Health & Social Care NHS Foundation Trust, West London NHS Trust
2017/2018
England
Data missing from University Hospitals Of Leicester NHS Trust, North West Anglia NHS Foundation Trust, Mid Yorkshire Hospitals NHS Trust, Leeds Teaching Hospitals NHS Trust, Barking, Havering and Redbridge University Hospitals NHS Trust
Appendix D – List of languages
Afaan Oromoo
Afar
Afrikaans
Akan
Albanian
Amharic
Arabic
Armenian
Assyrian
Azerbaijani
Bahdini
Bambara
Bengali
Bosnian
Bulgarian
Burmese
Cambodian
Cantonese
Catalan
Croatian
Czech
Danish
Dari
Dutch
Edo
Estonian
Farsi
Finnish
Flemish
French
French Sign Language
Fula
Gaelic
Georgian
German
Gheg
Greek
Gujarati
Haitian creole
Hakka
Hausa
Hebrew
Hindi
Hindko
Hokkien
Hungarian
Igbo
Indonesian
Inuktitut
Italian
Japanese
Karenic
Kashmiri
Khmer
Kinyarwanda
Kirundi /Rundi
Konkani
Korean
Kurdish Bahdini
Kurdish Kurmanji
Kurdish Sorani
Laotian
Latvian
Lingala
Lithuanian
Luganda
Maay Maay
Malay
Malayalam
Maltese
Mandarin Chinese
Mandingo / Mandinka
Mirpuri
Mongolian
Nepali
Nigerian pidgin
Oromo
Palauan
Pangasinan
Papiamento
Pashto
Polish
Portuguese (Brazil)
Portuguese (Portugal)
Punjabi
Romanian
Romany
Russian
Serbian
Shona
Sinhala
Slovak
Slovenian
Somali
Soninke
Spanish
Sudanese
Susu
Swahili
Swedish
Sylheti
Tagalog
Tai
Tajik
Tamil
Telugu
Thai
Tibetan
Tigrinya
Turkish
Turkmen
Twi
Ukrainian
Urdu
Uzbek
Vietnamese
Welsh
Wolof
Yoruba
Zulu
Authors: Alina Cincan, Flo Bejgu
For any comments or suggestions, please get in touch with Alina Cincan
 NHS spending on translation and interpreting services
by
Alina Cincan,
Flo Bejgu
is licensed under
Attribution-NonCommercial-ShareAlike 4.0 International
NHS spending on translation and interpreting services
by
Alina Cincan,
Flo Bejgu
is licensed under
Attribution-NonCommercial-ShareAlike 4.0 International
The data provided under the FOIA by each Trust or Health Board contains public sector information licensed under the Open Government Licence v3.0.